Dismantling Racism Requires Action from Everyone
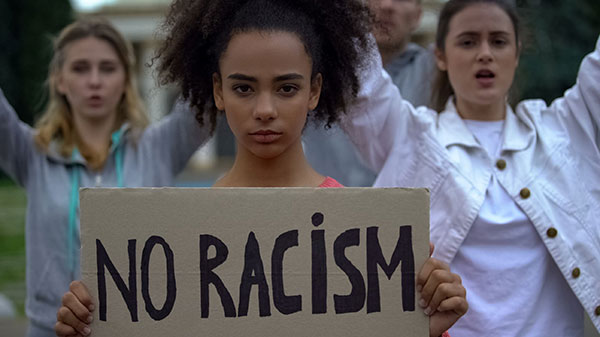
Everyone I know has been deeply affected by the demonstrations and protests that took place following the deplorable killing by police of George Floyd in Minneapolis in late May and Rayshard Brooks in Atlanta in June—and so many other African Americans over many years. Across the nation and around the world, we’re hearing people call for change—for police reform, certainly, and to end systemic racism and achieve racial equity.
We’re talking about race at work and with friends and family. Even when there’s disagreement, the conversation broadens understanding. As a white person, I see other white people at many levels of awareness. As a rising tide lifts all boats, I believe everyone has greater awareness now of the unconscionable treatment of many Black people and the societal oppression that people of color experience every day.

Have aging or disability issues? Call Community Living Connections toll-free at 844-348-5464 for confidential, professional, and local information and referrals, free of charge.
We must dismantle racism. Everyone has a role to play. At times it will be uncomfortable, but everyone in any position of power needs to look at their own decisions and actions on an ongoing basis and remove barriers to equity for all people.
I thought first to look at my own work—in this case, as chair of the Seattle-King County Advisory Council on Aging & Disability Services. I’ve only just begun.
I revisited the Area Plan for King County—the roadmap that Aging and Disability Services uses to guide their programs and services—and took a fresh look at racial data in the demographics section. Here are some observations—some of which are noted in the Area Plan already:
- In 2018, among the age 60+ population in King County, 23 percent were people of color—15 percent Asian, five percent Black/African American, and three percent Latinx. King County’s total population comprised 40 percent people of color. This number indicates that people of color will represent a much higher percentage of our population in the future.
- Current population data sources do not include disaggregated race information (e.g., the U.S. Census and other sources tell us the number of Asian people living here but do not provide dependable data for Chinese, Japanese, Korean, Vietnamese, and other Asian communities, and all too often, data about people of African descent who were born here is lumped together with data about African immigrants).
- People of color in King County—regardless of age—are more likely to have a disability. Disability rates among people age 65+ range from 32 percent for people who are White or Asian; to 38 percent for Latinx people; to 40 percent for Indigenous and Black/African American people; to 41 percent for people identifying as mixed race; and finally to 44 percent for Native Hawaiian/Pacific Islander people. An Area Plan footnote points to the nexus between disability and poverty.
Foreign birth and languages other than English do not indicate race but do influence culture and cultural competency. A couple Area Plan data points to consider:
- Approximately 22 percent of our county’s population was born in another country. Foreign-born residents account for almost half of King County’s growth over the past two-and-a-half decades. The highest percentages of foreign-born populations live in east and south King County communities.
- Among people age 60+ in King County, 19 percent speak a language other than English at home. And among those born in other countries, 41 percent speak English “less than very well.” After English, the largest language groups among people age 60+ speak Chinese (multiple dialects), Spanish, Tagalog, Vietnamese, and Korean.
Next, I looked at our most recent client profile—demographics of the people ADS served in 2019. Following is high-level view for each broad service area. I’m using “POC” to indicate People of Color; however, disaggregated racial data is available online for each service area and each program within the service area.
- Adult Day Services: 56% POC, 22% White, 22% Other
- Case Management: 53% POC, 38% White, 9% Unknown/Other
- Elder Abuse: 13% POC, 59% White, 28% Unknown
- Family Caregiver Support: 47% POC, 34% White, 19% Unknown/Other
- Health Promotion: 57% POC, 40% White, 3% Unknown
- Information & Assistance (Community Living Connections): 53% POC, 31% White, 16% Unknown/Other
- Mental Health (PEARLS): 40% POC, 45% White, 15% Other/Unknown
- Nutrition (congregate, emergency, and home-delivered meals): 32% POC, 35% White, 33% Other/Unknown
- Senior Centers: 38% POC, 16% White, 46% Other/Unknown
- Transportation (nutrition and volunteer): 42% POC, 47% White, 11% Other/Unknown
A vast majority of ADS clients have low or very low incomes. Many programs have an income eligibility requirement, but not all. For instance, people of any income can access basic caregiver support services and enjoy activities at senior centers, and should not hesitate to call Community Living Connections (844-348-5464) to get the information and assistance they need to care for themselves or a loved one.
Examining the social determinants of health
Perhaps you’ve heard it said—your zip code determines how long you’ll live. Washington state has the 8th-highest life expectancy in U.S. overall but local data points to dramatic differences by neighborhood. A study released in 2017 shows a life expectancy discrepancy of as many as 18 years among census tracts in King County. But why?
It’s good to look at what health and human services providers call “The Social Determinants of Health”—those socioeconomic and environmental factors that support or deter good health. Borrowing heavily from HealthyPeople.gov, those factors include:
- Resources to meet basic needs (e.g., safe housing, food)
- Socioeconomic conditions (e.g., concentrated poverty and the stressful conditions that accompany it)
- Health literacy—the degree to which individuals process and understand basic health information needed to make appropriate health decisions—and access to quality and culturally competent health care services.
- Exposure to crime, violence, and social disorder (e.g., presence of trash and lack of cooperation in a community)
- Technology access (e.g., cell phones, Internet, social media)
- Access to arts and culture
- Exposure to green space and recreational settings (e.g., trees, grass, and parks) and opportunities for leisure-time activities
- Literacy—written and spoken language
- Public safety
- Education and job training, and access to job opportunities
- Residential integration or segregation
- Safe, accessible environment (e.g., buildings, sidewalks, bike lanes, roads, benches)
- Social norms and attitudes (e.g., discrimination, racism, and distrust of government)
- Social support
- Transportation options
It shouldn’t be a stretch of anyone’s imagination to see how racial oppression (power + control + race) can affect access and opportunity in every facet of life in our society, and therefore health outcomes.
Some try to say that we have a poverty problem, not a race problem. Listen to the protests. Look at who gets killed. Look at the data. People of color are more likely to experience multidimensional oppression than white people, no matter what economic status they hold. And no matter how poor, white people hold unearned privilege in our white society based entirely on the color of their skin.
I recommend reading “White Privilege: Unpacking the Invisible Knapsack,” by Peggy McIntosh. For a deeper dive, read “White Fragility: Why It’s So Hard for White People to Talk About Racism” or any other book by Dr. Robin DiAngelo of Seattle (which should be available at Seattle Public Library and King County Library System).
Ask the hard questions

The COVID-19 pandemic is still very real, especially for older people and anyone with underlying health issues, who should continue to stay home and stay safe. For accurate information, including data and current recommendations, visit Public Health—Seattle & King County at www.kingcounty.gov/COVID.
Washington holds the #1 rank among states on the AARP Long-Term Care Scorecard, and Aging and Disability Services clients represent about one-quarter of the state’s long-term services and supports clients. We excel in many areas and we can always strive to improve effectiveness. It’s imperative that the collective “we”—our Advisory Council, ADS and other Area Agency on Aging staff, community partners, DSHS ALTSA, W4A, N4A, the Senior Lobby, state and federal elected officials, and more—ask the hard questions:
- How does this program or service affect racial equity? How do outcomes differ by race?
- Who is best served by this program or service? Who is not served well by it, and why?
- Who is hurt if this program or service is not funded?
- What steps have you taken to ensure clients, their families, and the broader community have been heard?
- How did their voices make a difference in how this program or service is administered?
I commend King County Executive Dow Constantine and Public Health—Seattle & King County Director Patty Hayes for declaring racism a public health crisis. Please take time to read “Racism is a Public Health Crisis: The Transformation Starts Here. It Starts with Us.” (Public Health Insider, 6/11/2020) That article is republished with permission in this issue of AgeWise.
Budget cuts are not a good excuse
As I write this, I’m fully aware that the State of Washington anticipates an $8.9 trillion budget shortfall in this biennium. The State is already modeling different types of budget cuts. Without a doubt, the recession that is just starting is going to hurt and could be devastating.
But it’s too easy to claim the economy as a reason to do what we’ve always done. A better approach is to acknowledge that, during a recession, Area Agency on Aging services are needed more than ever before. People are already hurting, and a worsening economy will send hundreds of thousands into a downwards spiral—not only financial decline but declining health and even premature death. We need to keep asking the hard questions and ensure—to the very best of our ability—that our programs and services serve people of color equitably and effectively. That’s the goal, in good times and bad.
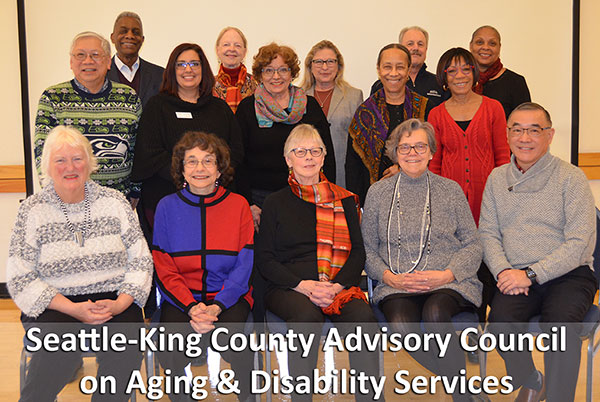
 Contributor Ava Frisinger chairs the Seattle-King County Advisory Council on Aging & Disability Services, which publishes AgeWise King County. She welcomes input from readers via e-mail (advisorychair@agewisekingcounty.org) as well as applicants for open positions on the council. For more information, visit www.agingkingcounty.org/advisory-council.
Mark Your Calendars
Following are some of the virtual events (online or phone meetings) that ADS Advisory Council members are interested in attending:
- Close to Home: Stories of Health, Tech and Resilience: Thursdays, July 2, 9, 23, and 30 (10:30 a.m.) online only. To log on at event time, visit bit.ly/AgeFriendlyLive.
- ADS Advisory Council: Friday, July 10 (12–2 p.m.) online only. To receive a link to join the meeting, e-mail Sariga.Santhosh@seattle.gov in advance.
- Age Friendly Seattle Civic Coffee Hour: Thursday, July 16 (10:30–11:30 a.m.) featuring ADS Director Cathy Knight and ADS Advisory Council Advocacy Chair June Michel. Online only—to log on at event time, visit bit.ly/AgeFriendlyLive.
- Mayor’s Council on African American Elders: Friday, July 17 (2:00–3:30 p.m.) online only. To receive a link to join the meeting, e-mail Karen.Winston@seattle.gov in advance.
- ADA 30th Anniversary Celebration—Seattle Channel: Sunday, July 28 (2–5 p.m.) on Seattle Channel.
- ADA 30th Anniversary Celebration—TVW: Monday, July 29 (11 a.m.–1 p.m.) on TVW.
For more local Aging Network events, click here.